CLUE sensor plotter
Plot live readings from CLUE's onboard sensors directly on its color screen with CircuitPython.
View original project ↗What you’re building
The CLUE Sensor Plotter is an Adafruit CircuitPython program that graphs live readings from the CLUE’s onboard sensors and three analog edge pads on its color LCD. Its design separates ten sensor data sources, a Plotter class, and a main interaction loop. Button A cycles sources with a short press and exposes palette, serial-output, and y-axis-lock actions through progressively longer holds; button B changes plot style. The result is a standalone, continuously updating sensor graph, with optional serial data suitable for Mu’s plotter. It requires CircuitPython 5 or later and a specific set of Adafruit sensor and display libraries copied into CIRCUITPY/lib. The source was developed against CircuitPython 5.0.0 and its matching 5.x library bundle, so runtime and compiled .mpy library versions must match. Using the edge pads as analog inputs prevents using them simultaneously as touch controls.
Key steps
- Install a CLUE-compatible CircuitPython release and confirm the CIRCUITPY drive appears.
- Download the matching CircuitPython library bundle and copy the guide’s listed sensor, display, bus, and NeoPixel libraries into /lib.
- Copy the sensor plotter program and its supporting modules to CIRCUITPY with the main script named code.py.
- Restart the CLUE and confirm a live graph appears from the initial PlotSource.
- Use short and long A-button presses to change source, palette, serial output, or range lock, and B to change plot mode.
- If using external analog signals, connect only safe voltages to the documented pads and confirm those pads are not expected as touch inputs.
Original project and code
Original project pages, manufacturer documentation and repositories used while preparing this page. Last reviewed .
Hardware for this project
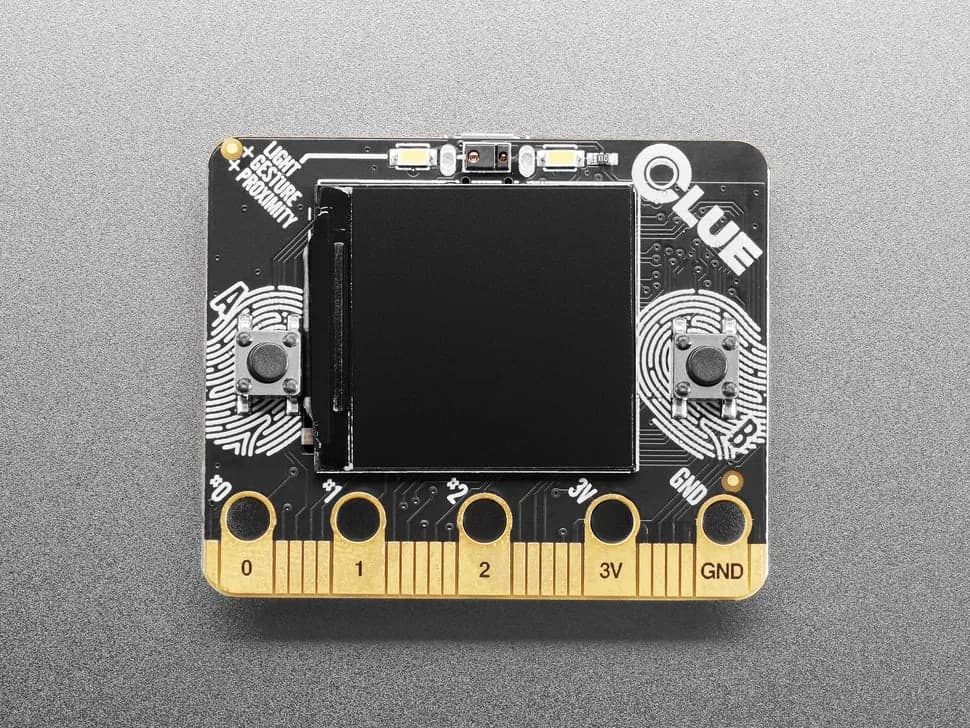
CLUE
nRF52840 sensor board in a micro:bit-like shape with color display, motion, environmental, light, gesture and sound sensing.
- Platform
- Nordic nRF52840, CircuitPython/Arduino · Circuitpython
- Builds
- 02