01
CLUE sensor plotter
Plot live readings from CLUE's onboard sensors directly on its color screen with CircuitPython.
data visualization
This topic focuses on making live sensor behavior legible on the device itself. Adafruit’s CLUE Sensor Plotter graphs readings from ten onboard or edge-pad sources on the CLUE color display, with button gestures for changing source, palette, plot style, serial output, and y-axis locking. It differs from a remote dashboard because acquisition, interaction, and plotting all run in CircuitPython on the handheld, while optional serial output can feed Mu’s plotter. Use a CircuitPython release and compiled MPY library bundle from the same major version; mismatched bundles commonly fail. The three analog edge pads cannot simultaneously serve as plot inputs and touch controls, so plan interaction before wiring sensors. Compare compatible devices, explore original projects and use the linked guides to get moving.
2 entriesOriginal project pages, manufacturer documentation and repositories used while preparing this page. Last reviewed .
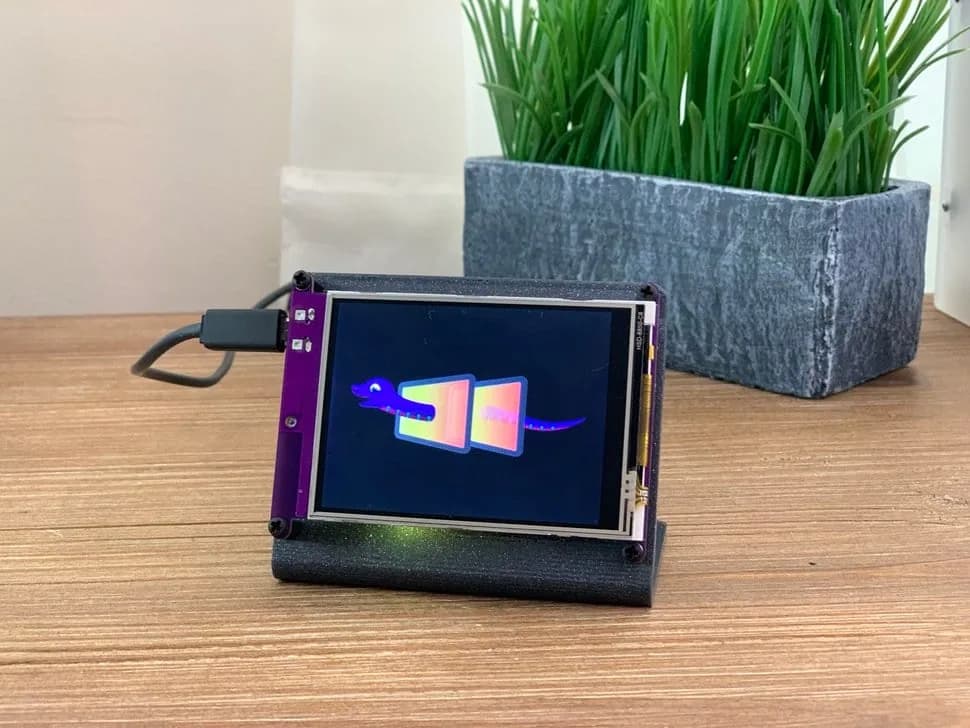
CircuitPython internet display with a 3.2-inch resistive touchscreen, SAMD51 controller and ESP32 Wi-Fi coprocessor.
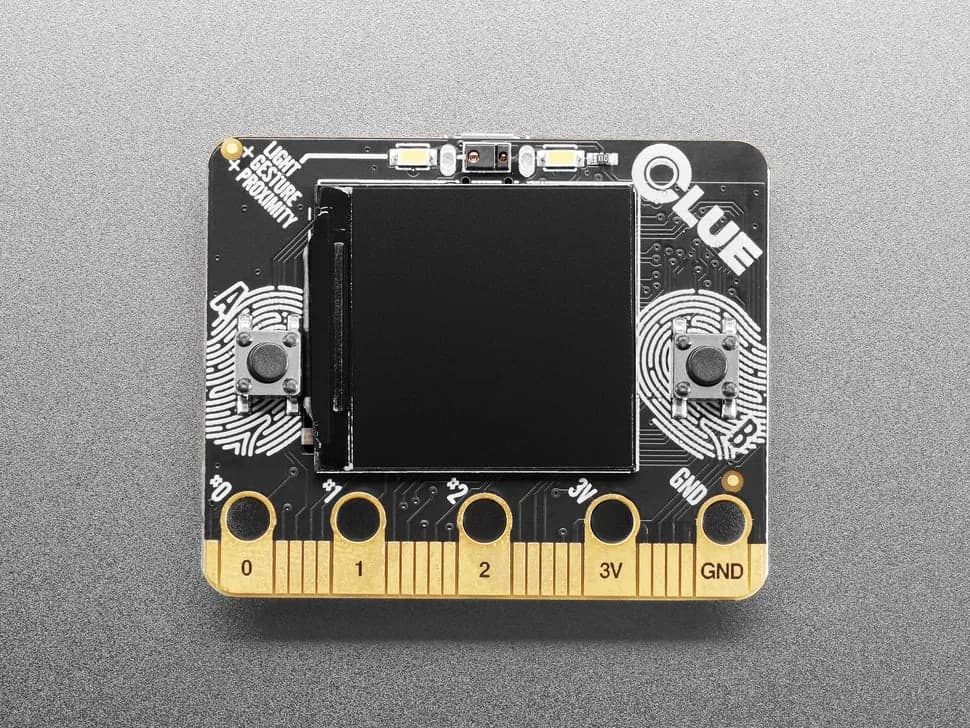
nRF52840 sensor board in a micro:bit-like shape with color display, motion, environmental, light, gesture and sound sensing.
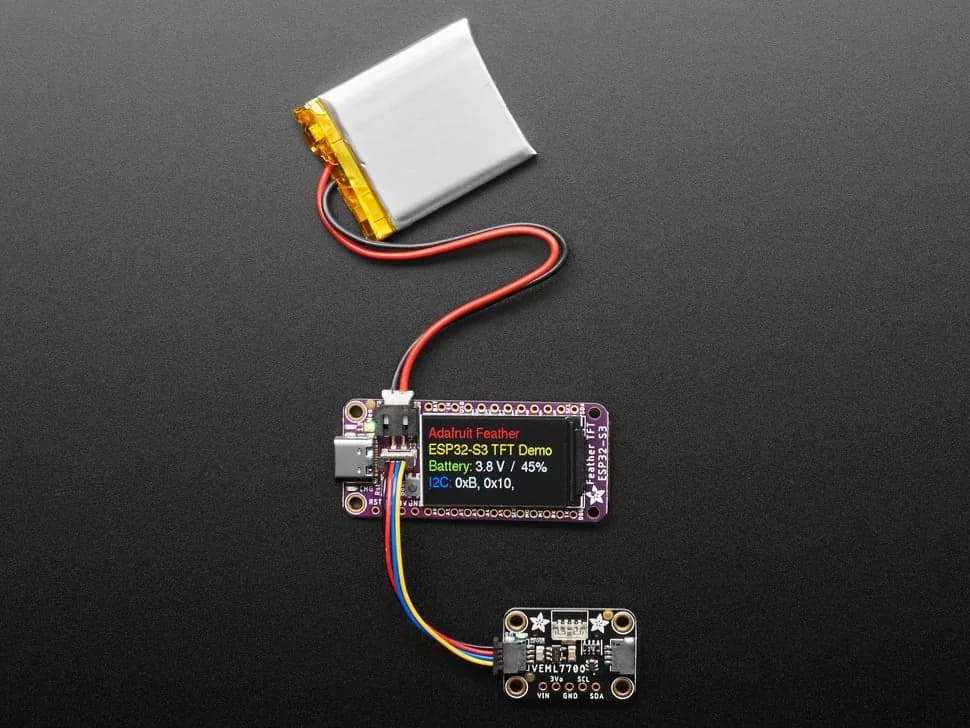
Feather-format ESP32-S3 board with built-in 1.14-inch color TFT, battery charging and STEMMA QT expansion.